| FinCEN.gov
December 04, 2025
WASHINGTON—Today, the U.S. Department of the Treasury’s Financial Crimes Enforcement Network (FinCEN) is issuing a Financial Trend Analysis on ransomware incidents in Bank Secrecy Act (BSA) data between 2022 and 2024, which totaled more than $2.1 billion in ransomware payments.
WASHINGTON—Today, the U.S. Department of the Treasury’s Financial Crimes Enforcement Network (FinCEN) is issuing a Financial Trend Analysis on ransomware incidents in Bank Secrecy Act (BSA) data between 2022 and 2024, which totaled more than $2.1 billion in ransomware payments.
“Banks and other financial institutions play a key role in protecting our economy from ransomware and other cyber threats,” said FinCEN Director Andrea Gacki. “By quickly reporting suspicious activity under the Bank Secrecy Act, they provide law enforcement with critical information to help detect cybersecurity trends that can damage our economy. This work is vital to safeguarding our nation’s financial sector and strengthening our national security.”
Previous FinCEN Financial Trend Analyses have focused on reported ransomware payments and incidents by the date the activity was filed with FinCEN. Today’s report shifts the focus to the incident date of each ransomware attack and offers greater visibility into the activities conducted by ransomware actors.
Reported Ransomware Incidents and Payments Reach All-Time High in 2023
Ransomware incidents and payments reported to FinCEN reached their highest level in 2023 with 1,512 incidents, totaling $1.1 billion in payment—an increase of 77 percent in total payments year-over-year from 2022 to 2023.
Following law enforcement’s disruption of two high-profile ransomware groups, ransomware incidents reported to FinCEN decreased in 2024, with 1,476 incidents, reflecting $734 million in the aggregate value of reported payments in BSA reports.
The median amount of a single ransomware transaction was $124,097 in 2022; $175,000 in 2023; and $155,257 in 2024. Between 2022 and 2024, the most common payment amount range was below $250,000.
FinCEN Data Shows Ransomware Payments Top $2.1B in Just Three Years
During the three-year review period (January 2022 – December 2024), FinCEN received 7,395 BSA reports related to 4,194 ransomware incidents totaling more than $2.1 billion in ransomware payments.
During the previous nine-year period (2013 through the end of 2021) FinCEN received 3,075 BSA reports totaling approximately $2.4 billion in ransomware payments.
Financial Services, Manufacturing, and Healthcare were the Most Impacted Industries
The manufacturing industry accounted for 456 incidents totaling approximately $284.6 million reported payments; the financial services industry accounted for 432 incidents totaling approximately $365.6 million reported payments; and the healthcare industry accounted for 389 incidents totaling approximately $305.4 million reported payments.
The Onion Router (TOR) was the Most Common Communication Method Reported
Threat actors most often communicated with their intended ransomware targets via messages sent over The Onion Router protocol, accounting for 67 percent of reports that provided the communication method.
Other ransomware threat actors communicated with their intended targets via email or through other private encrypted messaging systems.
ALPHV/BlackCat was the Most Prevalent Ransomware Variant Between 2022 and 2024
FinCEN identified more than 200 ransomware variants reported in BSA data.
The most reported variants were Akira, ALPHV/BlackCat, LockBit, Phobos, and Black Basta.
The 10 variants with the highest cumulative payment amounts identified in BSA reports accounted for approximately $1.5 billion in payments.
Ransomware is a complex cybersecurity problem requiring a variety of preventive, protective, and preparatory best practices. More information on FinCEN’s efforts to combat ransomware, including guidance and other resources for financial institutions, is available at www.fincen.gov/resources/fincen-combats-ransomware.
FinCEN’s FTA is available online at Ransomware Trends in Bank Secrecy Act Data
Questions or comments regarding the contents of this release should be addressed to the FinCEN Regulatory Support Section by submitting an inquiry at www.fincen.gov/contact.
FinCEN periodically publishes Financial Trend Analyses describing threat pattern and trend information derived from Bank Secrecy Act (BSA) filings to highlight priority illicit finance risks. These analyses provide information that is relevant to a wide range of consumers, businesses, and industries; communicate the value of BSA reporting; and enhance feedback loops between government users of BSA reports and their filers. Additionally, Financial Trend Analyses fulfill FinCEN’s obligations pursuant to section 6206 of the Anti-Money Laundering Act of 2020, which requires FinCEN to periodically publish threat pattern and trend information derived from BSA filings.
M-Trends 2025 data is based on more than 450,000 hours of Mandiant Consulting investigations. The metrics are based on investigations of targeted attack activity conducted between Jan. 1, 2024 and Dec. 31, 2024. Key findings in M-Trends 2025 include:
55% of threat groups active in 2024 were financially motivated, which marks a steady increase, and 8% of threat groups were motivated by espionage.
Exploits continue to be the most common initial infection vector (33%), and for the first time stolen credentials rose to the second most common in 2024 (16%).
The top targeted industries include financial (17.4%), business and professional services (11.1%), high tech (10.6%), government (9.5%), and healthcare (9.3%).
Global median dwell time rose to 11 days from 10 days in 2023. Global median dwell time was 26 days when external entities notified, 5 days when adversaries notified (notably in ransomware cases), and 10 days when organizations discovered malicious activity internally.
M-Trends 2025 dives deep into the aforementioned infostealer, cloud, and unsecured data repository trends, and several other topics, including:
Democratic People's Republic of Korea deploying citizens as remote IT contractors, using false identities to generate revenue and fund national interests.
Iran-nexus threat actors ramping up cyber operations in 2024, notably targeting Israeli entities and using a variety of methods to improve intrusion success.
Attackers targeting cloud-based stores of centralized authority, such as single sign-on portals, to gain broad access.
Increased targeting of Web3 technologies such as cryptocurrencies and blockchains for theft, money laundering, and financing illicit activities.

Mandiant analyzed 138 vulnerabilities that were disclosed in 2023 and that we tracked as exploited in the wild.

The following estimates are calculated using data from the NVD Dashboard. At the time of this reports generation, NVD's 2024 daily average for analyzing new CVEs is 30.27. There is a current backlog of 16777 CVEs awaiting analysis. With an average influx of 111.07 new CVEs per day, a daily average of 217.93 analyses is required to clear this backlog and process new CVEs. Currently, NVD is falling short of this goal by 187.66 CVEs a day. Given this data, if the current daily rate of CVE analysis persists, the projected number of CVEs awaiting analysis by the end of 2024 will be 29462.6.
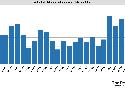
The number of ransomware attacks posted on extortion websites shot up to a record high in July, with ransomware gangs publicly claiming more than 15 attacks per day on average.
In total there were 484 ransomware attacks in July, compared to 408 the previous month, according to data collected by Recorded Future from extortion sites, government agencies, news reports, hacking forums, and other sources.

AdSearch ghosts, Qbot returns with new tricks, and PureCrypter loads malware treats.


